Domino launchers can accelerate collaboration between data scientists and non-technical stakeholders to gather information, propose new data, perform tasks, or propose different parameters. Launchers are self-serve web forms that a data scientist quickly builds to expose pre-canned tasks to less technical users.
Data scientists can automate analysis runs for others and empower business users to ask more questions and experiment independently. Launchers reduce the barrier of "asking a data scientist" and increase fruitful conversations between stakeholders.
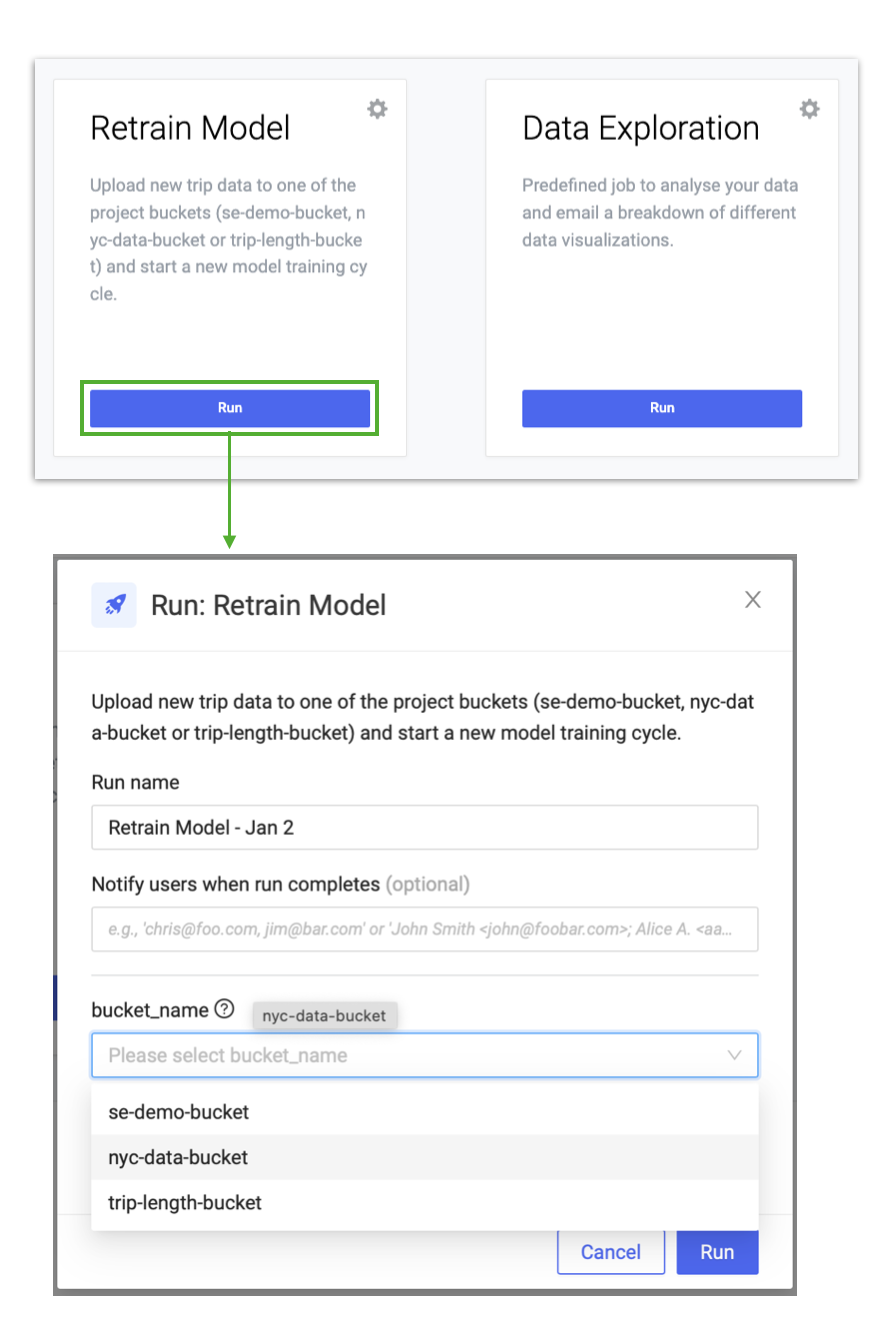
A launcher is a web form. When data scientists build a launcher, they expose web UI controls (such as a textbox or a drop-down menu) to a consumer who runs the launcher.
When a consumer completes the web form and runs the launcher, Domino passes the inputs into a script created by the data scientist as command-line parameters that initiates a job in Domino.
The results from the launcher depend on the script. Data scientists have the flexibility to create any result they need: PDFs, images, rendered notebooks, HTML, and so on. See tips and tricks for ideas to take advantage of this flexibility. Because launchers execute jobs under the hood, each run of a launcher is tracked, fully reproducible, and auditable.
The launcher user reviews the results through an email notification and the Jobs dashboard.
In your project, go to Launcher > New Launcher and fill in the fields in the launcher wizard to create a new launcher.
The essential component of a launcher is the command. The command runs as a job, with placeholder values for the command-line arguments.
Each argument you want to expose to the consumer must be written as ${arg}. You can mix hard-coded parameters with consumer-input parameters:
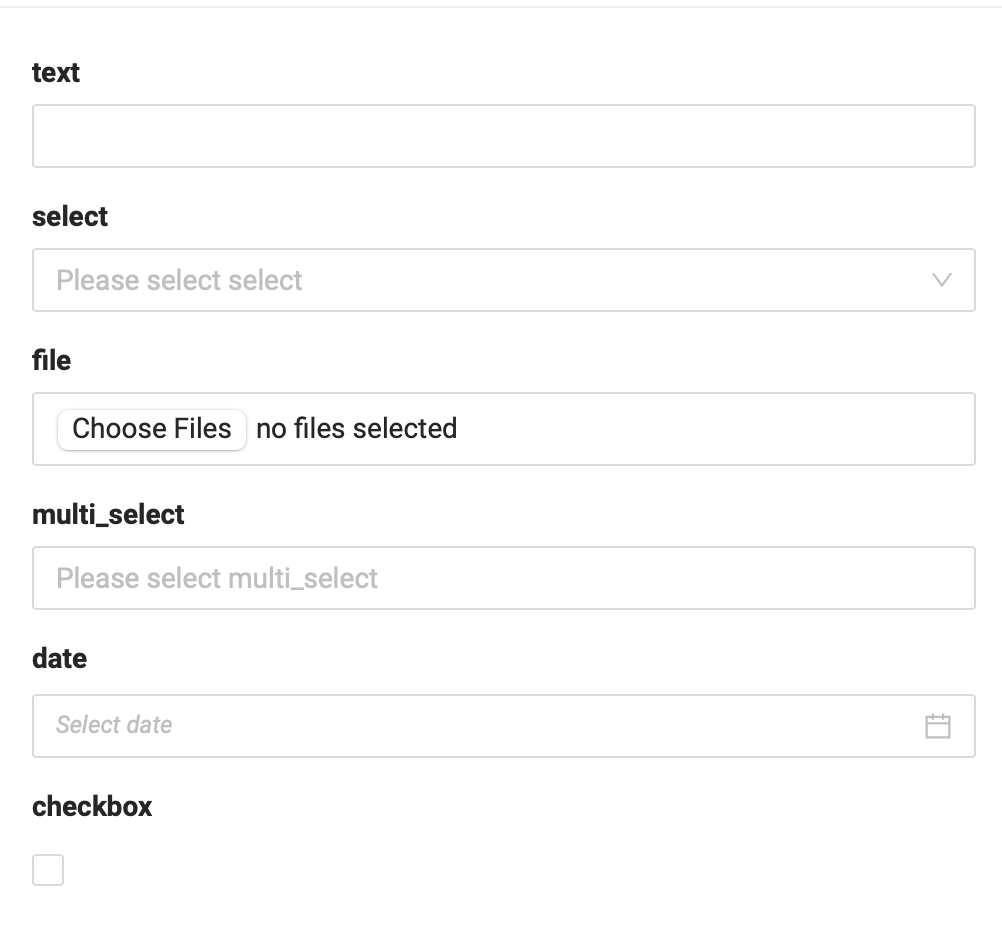
my_script.py -x=1 ${file} ${start_date}Launchers support these input controls:
-
Text - Input arbitrary text.
-
Select - Select one item from a list.
-
Multi-select - Select multiple items.
-
Date - Select a date.
-
Checkbox - Specify a binary yes/no value.
-
Upload file(s) - Upload one or more files that are passed to your script.
Each input type is rendered as shown below:
|
Note
| Domino captures results from the launcher run like it does from a job: any file your script creates or modifies. Commonly, launchers generate images or even HTML, which is included in email notifications sent to recipients and rendered in the results view for the associated job. |
How Domino passes arguments to your script
When parameter values are executed in a job started by the launcher, the values are encased in single quotes. This quotation preserves spaces and other special shell characters in the values. However, such values cannot be used to expand to environment variables.
File parameters are passed into your file as the path to the file. Note that uploaded files are persisted as results in the project. Domino projects are not designed to handle files greater than several GB in size or more than thousands of files.
Multi-select parameters are passed in as the comma-separated list of all selected choices.
Parse arguments in your script
For R, use the commandArgs function.
args <- commandArgs(trailingOnly=TRUE)
p1 <- args[1]
p2 <- args[2]

# a file upload parameter
print(readLines(args[3], n = 1))

# a multi-select parameter
for (each in strsplit(args[4],",")) {
  cat(each, sep="\n")
}|
Note
| File parameters are passed into your file as the path to the file. Multi-select parameters are passed in as the comma-separated list of all selected choices. |
See the detailed examples below.
Examples: handle arguments in R and Python
Our simple R example lets users input two numbers, and behind the scenes, we run some R code that adds them and prints the sum.
Our script is in a file called launcher.R, and we tell Domino to run
launcher.R 10 20. So, our launcher’s command is
launcher.R ${A} ${B}.
args <- commandArgs(trailingOnly = TRUE)
a <- as.integer(args[1])
b <- as.integer(args[2])
if (is.na(a)) {
  print("A is not a number")
} else if (is.na(b)){
  print("B is not a number")
} else {
  paste("The sum of", a, "and", b, "is:", a+b)
}Navigate to the Launchers section of a Project and click on a launcher.
Collaborators in the Contributors or Launcher User role can run a launcher. Results Consumers can view results from launchers but not run them.
An email with the results is sent to everyone on the notification list. A new job is also created in the Jobs dashboard, where the results and inputs are accessible.
|
Note
| This feature is only available in private deployments of Domino Enterprise. |
Use the Advanced Launcher Editor to access the JSON representation of a Launcher. This is useful if you want to copy Launcher definitions between projects.
-
Go to the launcher.
-
Click the gear icon and then click Edit (Advanced).
- Combine with knitr for report generation
-
Write an R script that knits a rich report in PDF, HTML, Markdown, etc., and flexibly expose parameters via a launcher to provide self-serve report generation to business users.
- Combine with Domino’s customized email notifications, e.g., email.html
-
If your launcher script generates an
email.htmlfile, that becomes the body of the notification email sent to the launcher consumer. Launchers work great to create custom visual results that are sent directly as email notifications. - Render Jupyter notebooks
-
If you run a Domino job with the name of an
ipynbfile, Domino calculates the notebook and saves it. This automation gives you an easy way to let end users update a notebook without opening Jupyter. For more advanced output formats, create a shell script that uses nbconvert to render a notebook as HTML or a PDF and email that to the launcher consumer. - Process data
-
Launchers are great when a user wants to upload a file and process the data, e.g., clean it and put it in a database.
- Score or infer with explainability
-
Launchers are great when a user wants to access input, run it through a model, and return the result with rich explainability data (provided via shap or lime, for example).
[[Launchers on remote dataplanes]] == Launchers on remote data planes
You may want to launch Jobs in a separate cluster or data plane from where the model was created, either for scalability or data locality reasons. Domino enables this workflow through its Launchers feature, allowing a Launcher to be deployed near where it adds the most value. When launching, select the hardware tier linked to your preferred local or remote data plane.