domino logo
Configuration
White labelingCentral ConfigurationNotificationsChange The Default Project For New UsersProject Stage Configuration
Compute
Diagnosing a stuck queueExecutor lifecycle managementExecutor maintenanceHardware Tiers and Cluster ControlsModel Resource Quotas
Data Management
Data in DominoDatasets AdministrationSubmit GDPR Requests
User Management
Restricted signupsRolesLicense Usage Reporting
Environments
Domino 3.6 Standard EnvironmentsCreating a new executor AMIEnvironment Management Best Practices
Disaster Recovery
Control Center
Control Center OverviewExport Control Center Data with The API
domino logo
About Domino
Domino Data LabKnowledge BaseData Science BlogTraining
Admin Guide
>
Control Center
>
Control Center Overview

Control Center Overview

The Control Center displays important data about your Domino deployment. From the Control Center, you can view deployment-wide usage of compute resources by hours of runtime or spend in USD. You can also drill down into detailed statistics on projects, hardware tiers, and users. The control center data is also available for export if you’d like to create your own reports or analysis.

Screen Shot 2018 09 05 at 1.03.09 PM

Who can access the Control Center?

At this time, only Domino Admins can view the Control Center. The Control Center shows detailed deployment-wide statistics and granular data on users and projects, and its functionality depends on the user having Admin permissions.

If you need access to the Control Center, contact your local Domino Administrator or email support@dominodatalab.com.
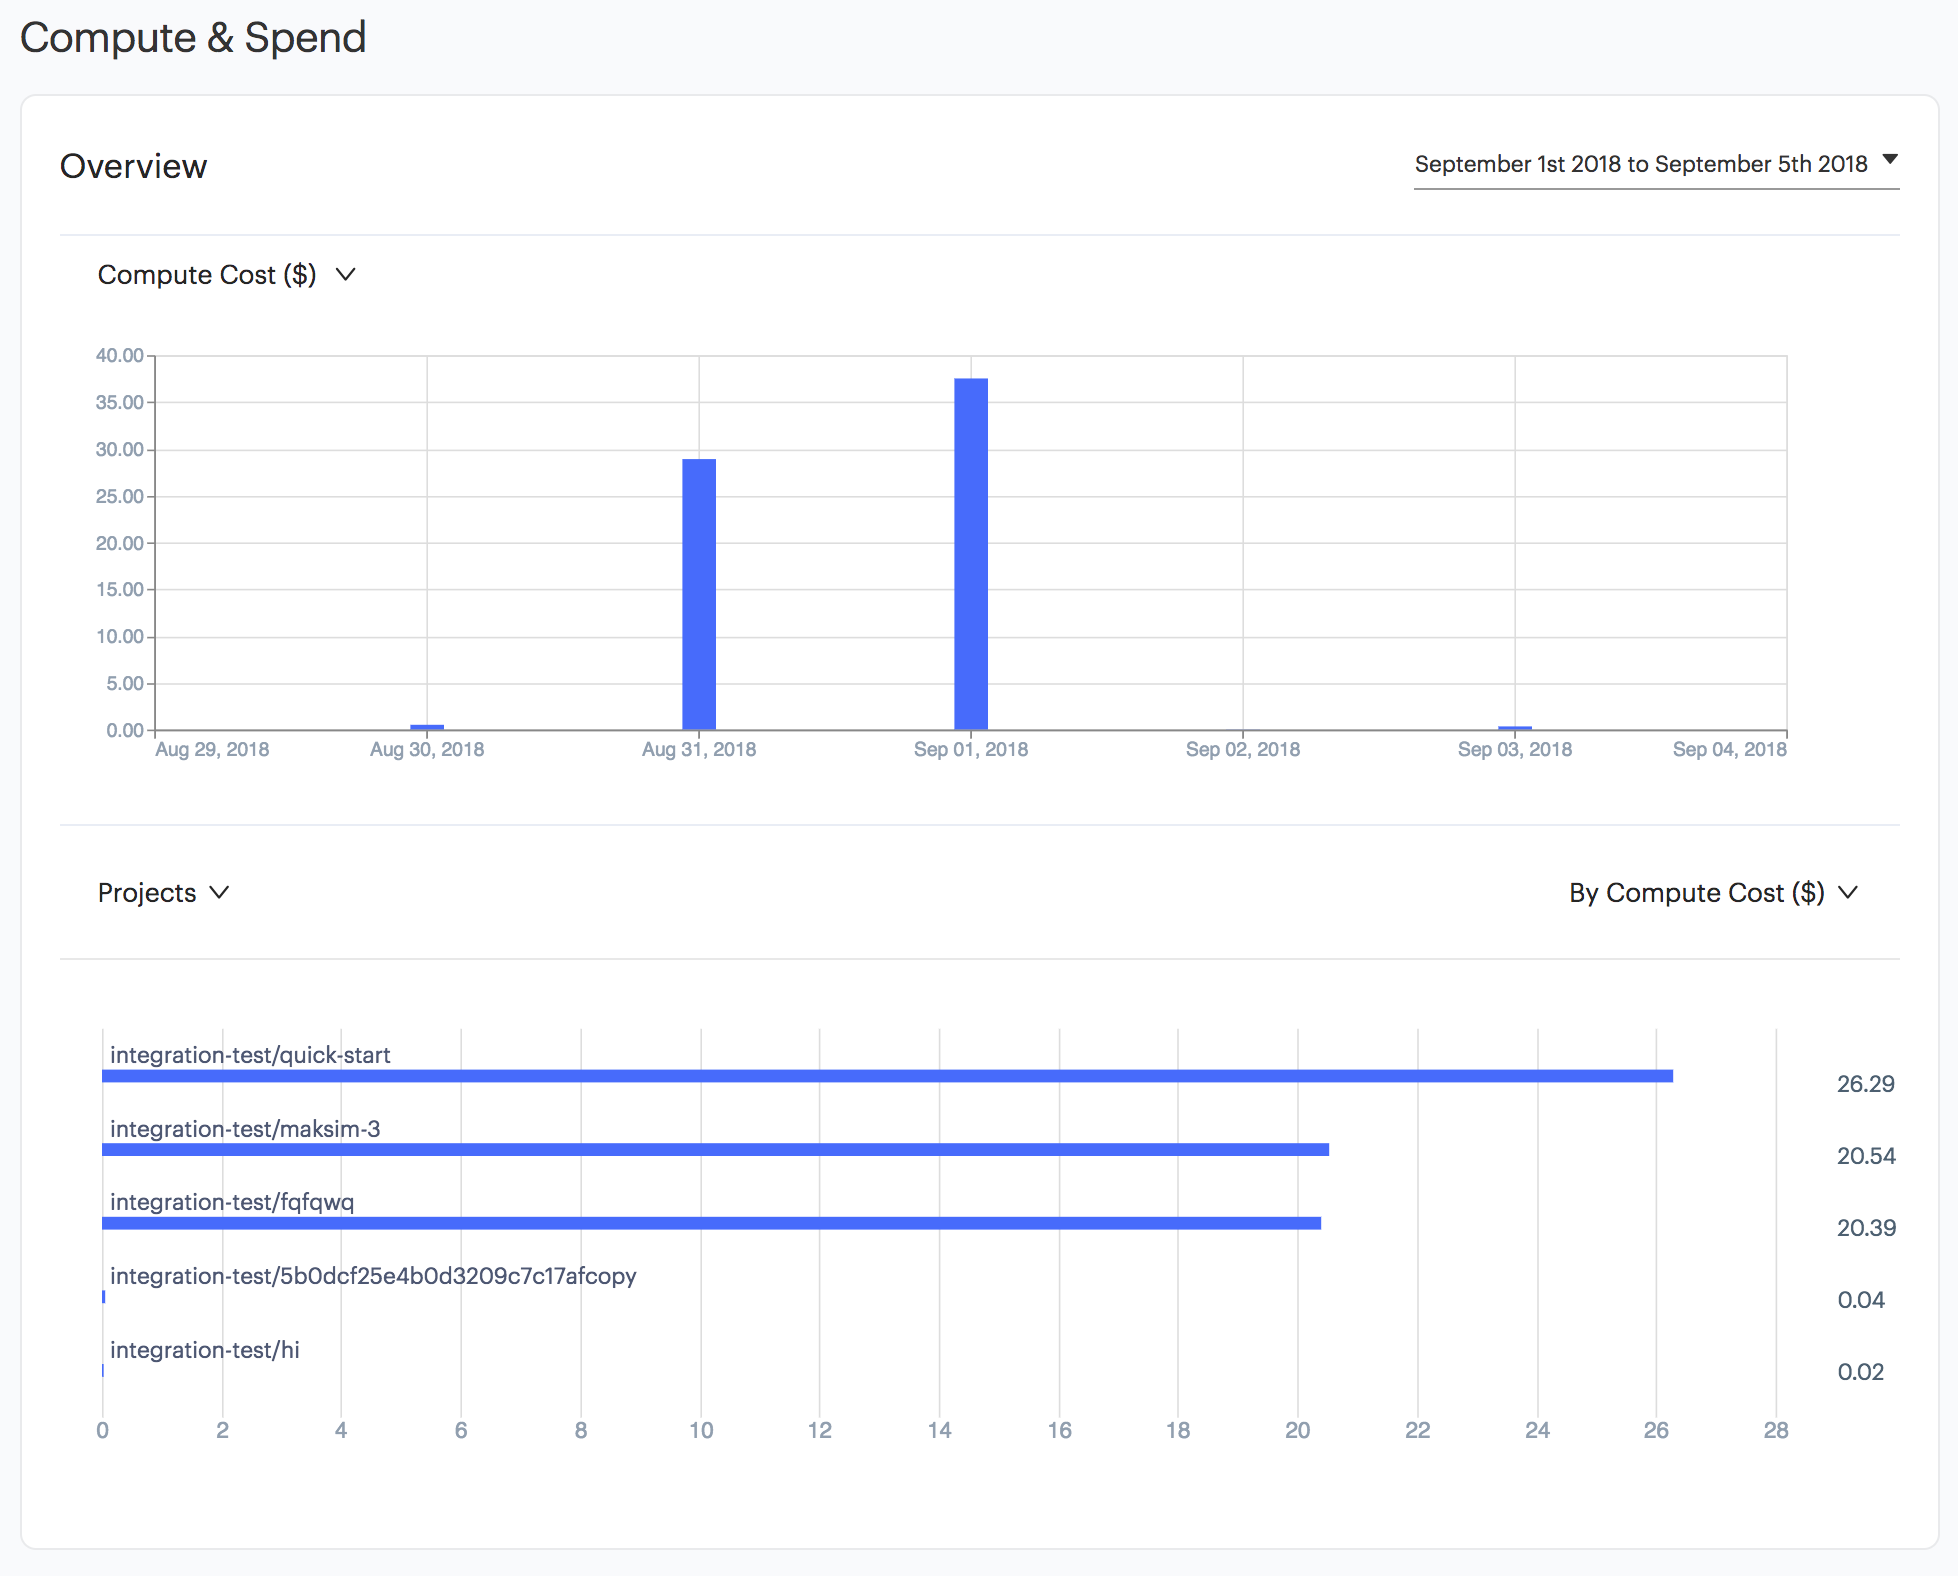
How do I open the Control Center?

If you have access to the Control Center, you’ll find a link to it in the Switch To menu.

Screen Shot 2018 10 15 at 6.20.15 PM

What metrics are available in the Control Center?

When you first open the Control Center, you’ll see a bar chart of deployment compute spend in USD for each day in the current month.

Screen Shot 2018 09 05 at 1.13.31 PM

About compute spend

Compute spend is based on settings applied by admins when creating and managing hardware tiers. Compute spend data will only be available in the Control Center if the "cents per minute" property is set on the hardware tier in use. These numbers also only represent active usage, and do not reflect other potential spend like idle cloud resources or storage.

You can change the date range shown with the dropdown menu in the upper right, and you can switch the chart to display compute usage by hours of runtime with the dropdown in the upper left.

Following the deployment-wide chart is a panel that displays more granular data on projects, users, and hardware tiers across the selected date range. You can chart these by the following metrics:

  • Projects can be charted by compute spend (USD) or compute hours

  • Users can be charted by compute spend (USD) or compute hours

  • Hardware tiers can be charted by average run queue time in minutes

Screen Shot 2018 09 05 at 1.30.52 PM

This chart will show the top five results for the chosen metric. When you have the chart set to display data on users, there will also be a View all link you can use to load a paginated table with detailed usage statistics for all users.

Screen Shot 2018 09 05 at 1.37.50 PM

By default, this table will show data for the date range that was set on the previous page. Use the menu if you want to change the date range.

Drill down for more details

Many of the tables and charts support drilling down for more detail on a specific item. Click one of the bars in a Control Center bar chart to see an expanded and detailed page on the related project, user, or hardware tier.

Some of these pages will also display a table of related runs. You can click an entry in a Run Logs table to view the specified run in the project Runs page.

Control center hardware tier page

This page shows performance averages for runs that use the specified hardware tier, and tracks completed runs. Details on all runs performed on the specified hardware tier are listed in the Run Logs table. Click an entry in the table to view the specified run in the project Runs page.

Screen Shot 2018 09 07 at 12.54.22 PM

Control center project page

This page breaks down project spend across Apps, Batch Runs, Endpoints, Launchers, Scheduled Runs, and Workspaces. All runs executed in the project are detailed in the Run Logs table. Click an entry in the table to view the specified run in the project Runs page.

Screen Shot 2018 09 07 at 12.58.13 PM

Control center user page

This page shows detailed data on a user’s activity in Domino. The top of the page has charts showing the types of runs this user starts, which projects the user works in, and which hardware tiers the user uses. You can click bars in the project and hardware tier charts to view the object represented. All runs started by this user are detailed in the Run Logs table. Click an entry in the table to view the specified run in the project Runs page.

Screen Shot 2018 09 07 at 1.11.48 PM
Domino Data LabKnowledge BaseData Science BlogTraining
Copyright © 2022 Domino Data Lab. All rights reserved.